Graphing linear equations may sound like something invented by a chalkboard with a grudge, but the idea is refreshingly simple: a linear equation makes a straight line. Once you understand how to place a few points, read slope, and spot intercepts, the graph stops looking like a mysterious grid and starts behaving like a map.
This guide walks you through the easiest ways to graph linear equations, including slope-intercept form, tables of values, intercepts, horizontal lines, vertical lines, and common mistakes to avoid. You will also see simple visuals you can copy, study, or use as mental “anchors” when solving problems.
What Is a Linear Equation?
A linear equation is an equation whose graph forms a straight line. In two variables, it often uses x and y. Common forms include:
- Slope-intercept form: y = mx + b
- Standard form: Ax + By = C
- Point-slope form: y – y1 = m(x – x1)
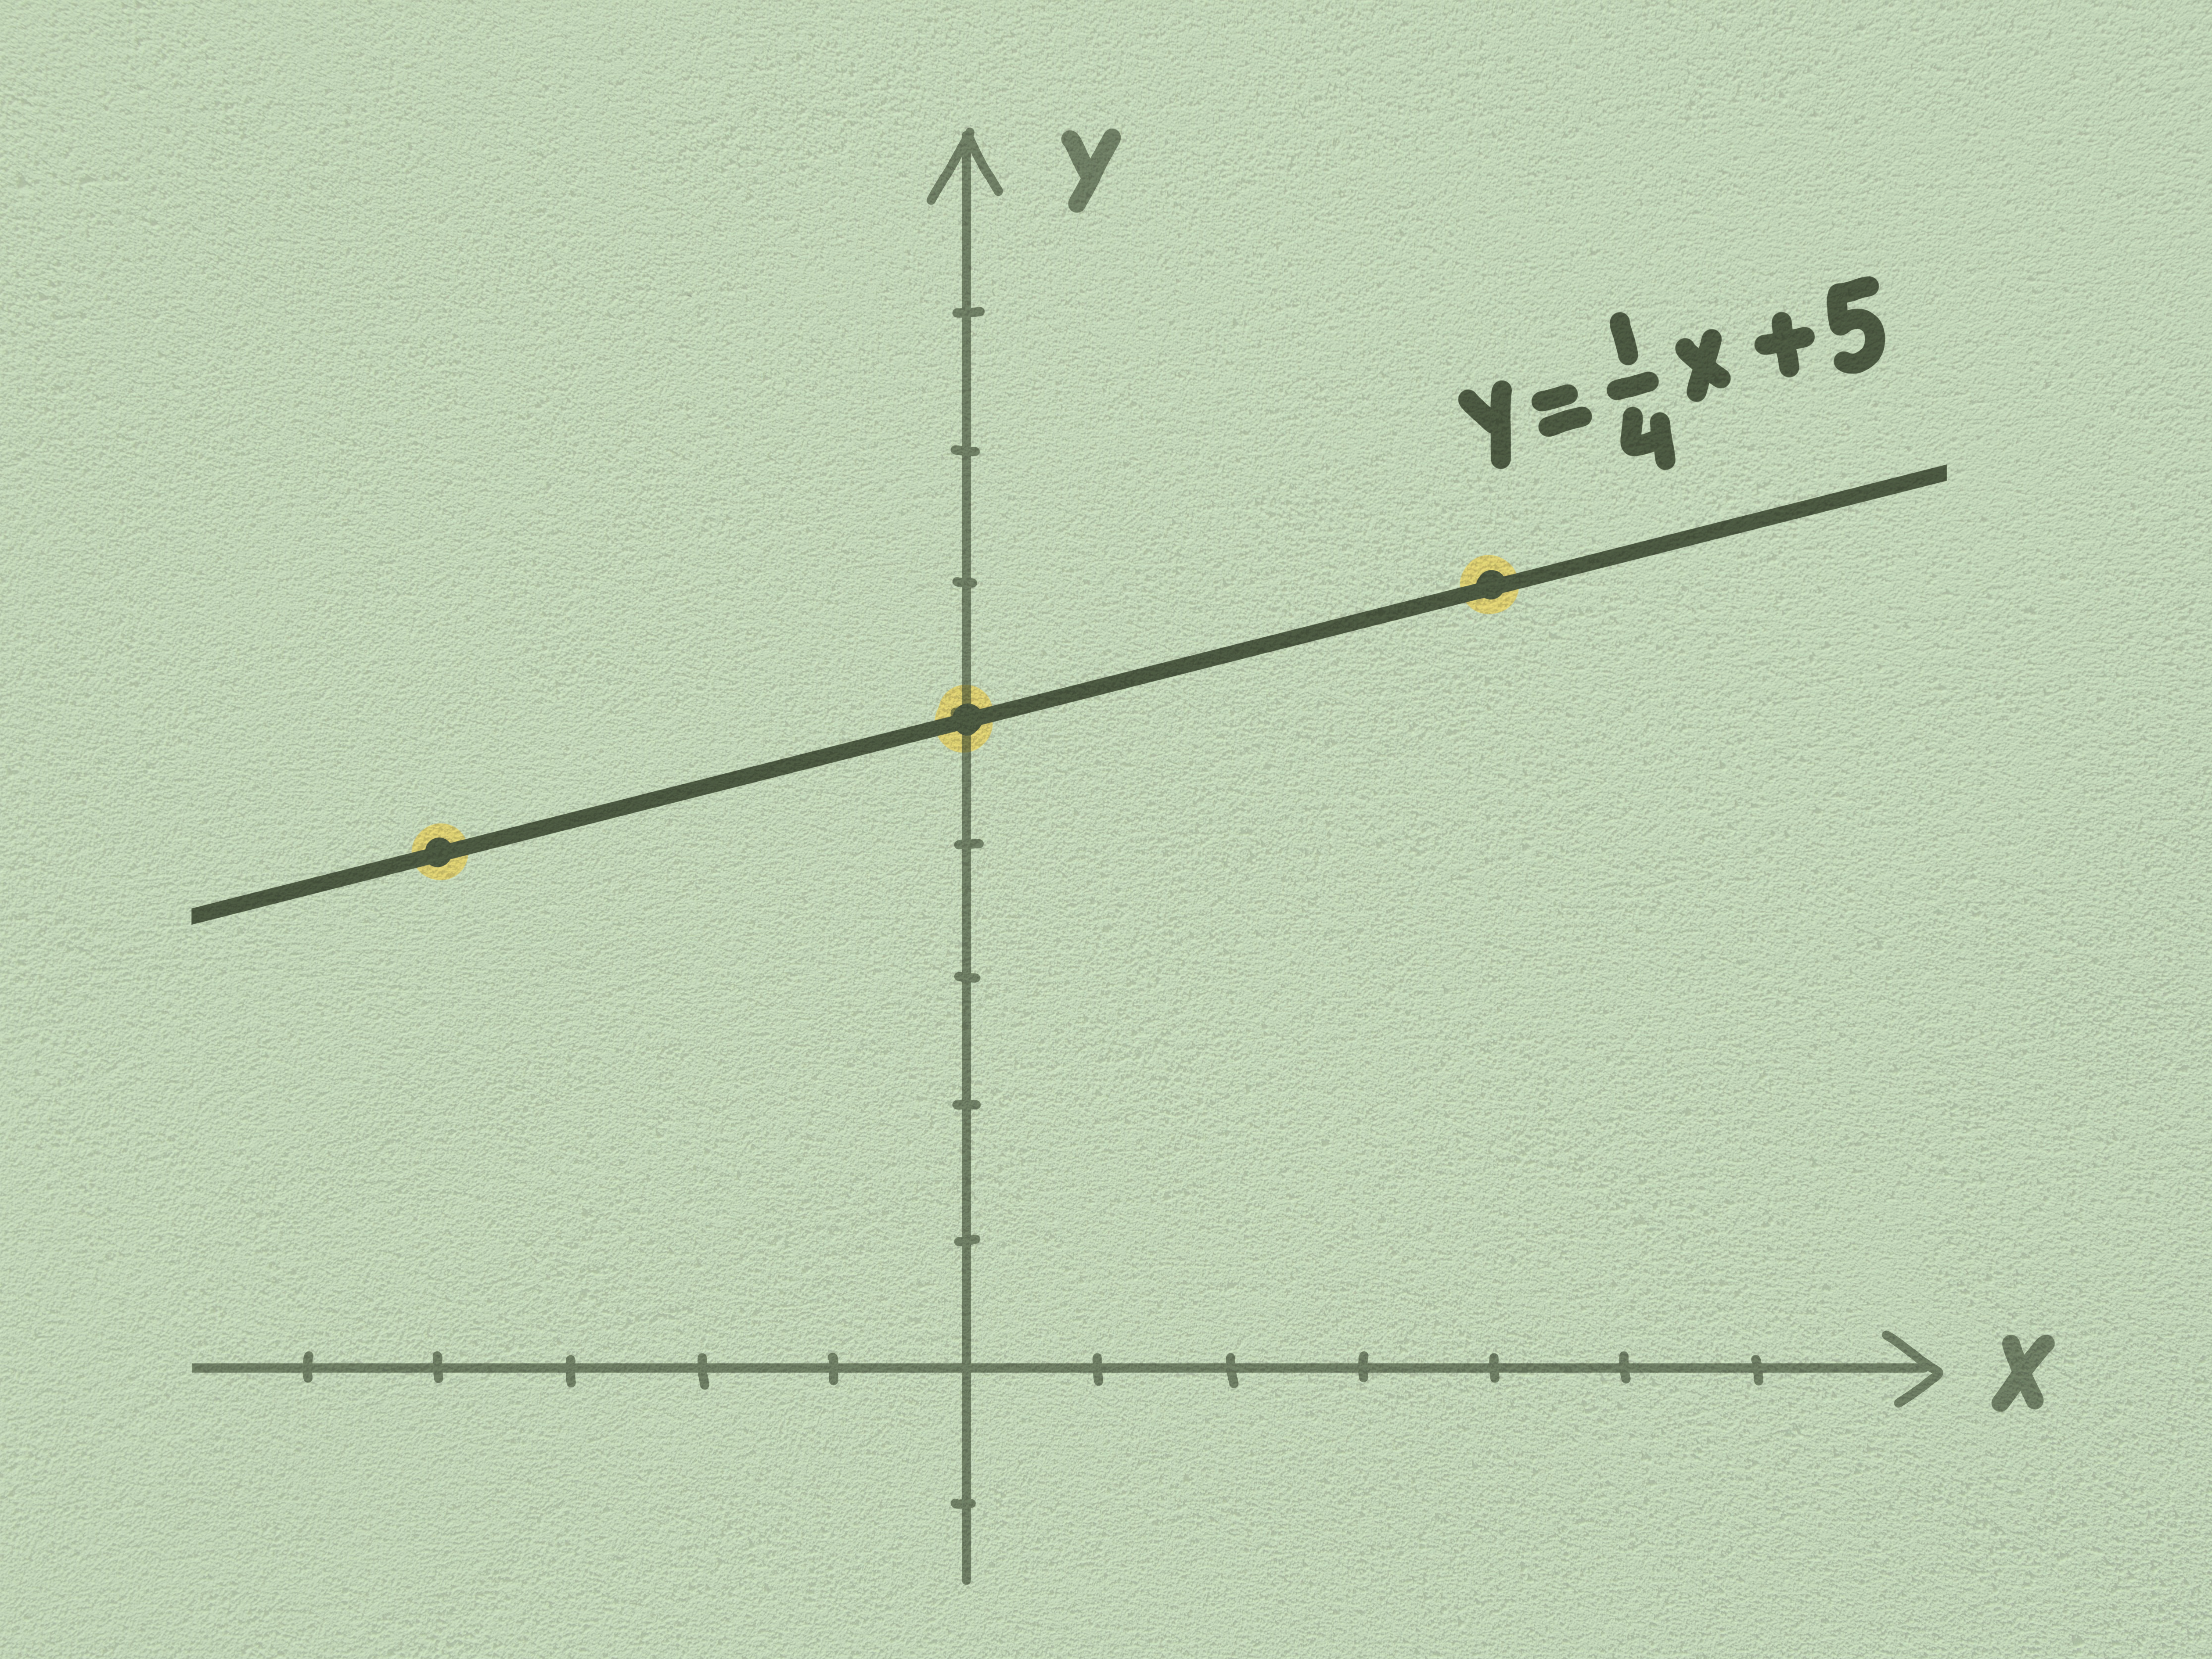
The most beginner-friendly form is y = mx + b. In this equation, m is the slope, and b is the y-intercept. Translation: m tells the line how steep to be, and b tells the line where to start on the y-axis. Think of slope as the line’s attitude. Positive slope? It climbs. Negative slope? It slides downhill dramatically, like it just read its test score.
Understanding the Coordinate Plane
Before you graph a linear equation, you need to know the playing field. The coordinate plane has two axes:
- The x-axis runs left and right.
- The y-axis runs up and down.
- The point where they cross is the origin, written as (0, 0).
Every point is written as an ordered pair: (x, y). The x-value tells you how far to move left or right, and the y-value tells you how far to move up or down.
Method 1: Graph a Linear Equation Using Slope-Intercept Form
The fastest method for many problems is slope-intercept form:
y = mx + b
Here is the simple process:
- Find b, the y-intercept.
- Plot the point (0, b) on the y-axis.
- Find m, the slope.
- Use slope as rise over run.
- Plot a second point.
- Draw a straight line through the points.
Example: Graph y = 2x + 1
In the equation y = 2x + 1, the slope is 2, and the y-intercept is 1. Since 2 can be written as 2/1, the slope means “rise 2, run 1.”
Start by plotting the y-intercept: (0, 1). Then move up 2 units and right 1 unit to find another point: (1, 3). Connect the dots, and congratulations: you have graphed the line without needing a math wizard robe.
Method 2: Graph a Linear Equation by Making a Table
If the equation is not immediately friendly, a table of values is a reliable backup plan. A table works because any point that satisfies the equation belongs on the line.
Example: Graph y = -x + 4
Choose a few x-values, substitute them into the equation, and calculate y.
| x | y = -x + 4 | Point |
|---|---|---|
| 0 | y = -(0) + 4 = 4 | (0, 4) |
| 1 | y = -(1) + 4 = 3 | (1, 3) |
| 2 | y = -(2) + 4 = 2 | (2, 2) |
After plotting the points, draw a straight line through them. You technically only need two points to draw a line, but three points help you catch mistakes. If two points line up and the third one is off in the corner wearing sunglasses, something went wrong.
Method 3: Graph Using x-Intercept and y-Intercept
The intercept method is helpful when an equation is written in standard form, such as Ax + By = C. An intercept is where a line crosses an axis.
- To find the x-intercept, set y = 0 and solve for x.
- To find the y-intercept, set x = 0 and solve for y.
Example: Graph 2x + y = 6
First, find the x-intercept:
2x + 0 = 6
2x = 6
x = 3
So the x-intercept is (3, 0).
Next, find the y-intercept:
2(0) + y = 6
y = 6
So the y-intercept is (0, 6). Plot both points and draw the line.
How to Graph Horizontal and Vertical Lines
Horizontal and vertical lines are special cases. They are simple, but they trick students because they do not always look like the usual y = mx + b examples.
Horizontal Lines: y = a Number
An equation like y = 3 means every point on the line has a y-value of 3. The x-value can be anything. The line goes straight across.
Examples of points on y = 3 include (-2, 3), (0, 3), and (5, 3).
Vertical Lines: x = a Number
An equation like x = -2 means every point on the line has an x-value of -2. The y-value can be anything. The line goes straight up and down.
Examples of points on x = -2 include (-2, -4), (-2, 0), and (-2, 5).
Here is the memory trick: y = number is horizontal, and x = number is vertical. Yes, it feels backwards at first. Math enjoys tiny plot twists.
How Slope Works: Rise Over Run
Slope measures steepness. It is usually written as a fraction:
slope = rise / run
The rise is the vertical change, and the run is the horizontal change. If the slope is positive, the line rises from left to right. If the slope is negative, the line falls from left to right. If the slope is zero, the line is horizontal. If the line is vertical, the slope is undefined.
Example: Slope of 3/2
A slope of 3/2 means move up 3 units and right 2 units from one point to another. A slope of -3/2 means move down 3 units and right 2 units, or move up 3 units and left 2 units. Both describe the same line direction.
How to Graph a Linear Equation from Standard Form
If you are given a linear equation like 3x – 2y = 8, you can graph it in two main ways: solve for y or use intercepts.
Option A: Solve for y
Start with:
3x – 2y = 8
Subtract 3x from both sides:
-2y = -3x + 8
Divide by -2:
y = 3/2x – 4
Now the equation is in slope-intercept form. The y-intercept is (0, -4), and the slope is 3/2. Plot the intercept, use rise over run, and draw the line.
Option B: Use Intercepts
You can also set y = 0 to find the x-intercept and set x = 0 to find the y-intercept. This method is often faster when the intercepts are whole numbers.
Common Mistakes When Graphing Linear Equations
1. Mixing Up x and y
Remember that ordered pairs always go in alphabetical order: (x, y). Move left or right first, then up or down.
2. Forgetting That b Is a Point on the y-Axis
In y = mx + b, the number b is not just a lonely number. It represents the point (0, b).
3. Treating Negative Slope Like Positive Slope
If the slope is negative, the line should fall from left to right. If your graph climbs instead, check the sign.
4. Drawing a Line Through Only One Point
One point is not enough to determine a line. Two points are required. Three points are even better when you are checking your work.
5. Using a Crooked “Straight” Line
Use a ruler or the edge of a notebook if needed. A graph of a linear equation should be straight, not “emotionally wavy.”
Practice Problems with Answers
Problem 1: Graph y = -2x + 5
The y-intercept is (0, 5). The slope is -2, or -2/1. Start at (0, 5), move down 2 and right 1, then draw the line.
Problem 2: Graph y = 1/3x – 2
The y-intercept is (0, -2). The slope is 1/3. Start at (0, -2), move up 1 and right 3, then connect the points.
Problem 3: Graph x + y = 4
Solve for y: y = -x + 4. The y-intercept is (0, 4), and the slope is -1. You can also use intercepts: when y = 0, x = 4, so the x-intercept is (4, 0).
Problem 4: Graph x = 2
This is a vertical line passing through every point where x equals 2. Examples include (2, -1), (2, 0), and (2, 4).
Real-Life Uses of Linear Graphs
Linear equations are not just classroom decorations. They appear whenever something changes at a constant rate. For example, a taxi fare may include a starting fee plus a fixed cost per mile. A phone plan may include a monthly charge plus a cost for extra data. A savings account may grow by the same amount each week if you deposit a fixed amount regularly.
In these situations, the y-intercept often represents the starting amount, and the slope represents the rate of change. If a babysitter charges $15 just to show up and $10 per hour, the equation could be y = 10x + 15. The slope is 10, meaning the cost increases by $10 per hour. The y-intercept is 15, meaning the starting cost is $15.
Quick Checklist: How to Graph Linear Equations
- Identify the form of the equation.
- If possible, rewrite it as y = mx + b.
- Plot the y-intercept (0, b).
- Use slope as rise over run.
- Plot a second point.
- Draw a straight line through the points.
- Check whether the line rises, falls, stays horizontal, or is vertical.
Extra Experience: What Learning to Graph Linear Equations Feels Like
Learning how to graph linear equations is a lot like learning how to ride a bike. At first, there are too many things to remember: slope, y-intercept, x-axis, y-axis, ordered pairs, signs, fractions, and that one pencil that mysteriously vanishes every time homework begins. But after a little practice, the process becomes surprisingly automatic.
One of the most helpful experiences is realizing that graphing is not separate from solving. Many students treat equations and graphs like they live in different neighborhoods, but they are really two views of the same idea. The equation gives instructions in symbols; the graph shows those instructions as a picture. When the equation says y = 2x + 1, it is quietly telling you, “Start at 1 on the y-axis, then climb 2 for every 1 step to the right.” Once that clicks, graphing becomes less about memorizing and more about translating.
A common student experience is getting stuck with fractions. A slope like 3/4 can look unfriendly, especially if you would rather the equation behave like a polite whole number. But fractions are actually great for graphing because they already tell you the movement: rise 3, run 4. The top number moves vertically, and the bottom number moves horizontally. That is much easier than converting everything into decimals and hoping the graph paper cooperates.
Another useful habit is checking the direction of the line before drawing it. If the slope is positive, the line should go upward from left to right. If the slope is negative, it should go downward from left to right. This simple check catches many mistakes before they become full-page disasters. It is like looking both ways before crossing the street, except the street is algebra and the cars are negative signs.
Graphing by making a table is also a confidence-builder. Even if slope-intercept form feels confusing, a table lets you create points step by step. Pick x-values, calculate y-values, plot the ordered pairs, and connect them. This method is slower, but it is dependable. It is the math version of taking the scenic route: not always the fastest, but you usually arrive safely.
Teachers often encourage students to use three points instead of two, and there is a good reason. Two points can make a line, but a third point can reveal an error. If the third point does not line up, one of your calculations or plotted points needs attention. That extra point is like a tiny detective with graph paper shoes.
The best experience comes when students begin connecting linear graphs to real life. A line can show money earned per hour, distance traveled over time, temperature changes, subscription costs, or the number of pages read each day. Suddenly, slope is not just a fraction; it is a rate. The y-intercept is not just a number; it is a starting point. A graph becomes a story about change.
For best results, practice with different equation forms. Start with easy slope-intercept equations, then try standard form, intercepts, horizontal lines, and vertical lines. Use graph paper or a digital graphing tool to compare your answer. The more lines you graph, the more familiar the patterns become. Eventually, you will look at y = -1/2x + 3 and immediately know the line starts at 3 and gently falls as it moves right. That is the moment when graphing linear equations stops feeling like a puzzle and starts feeling like a skill.
Conclusion
Graphing linear equations becomes much easier when you break the process into small steps. Start by identifying the equation form. If it is in slope-intercept form, use the y-intercept and slope. If it is in standard form, either solve for y or find the intercepts. For horizontal and vertical lines, remember that y = number goes across and x = number goes up and down.
The key is not memorizing every possible graph. The key is understanding what the equation is telling you. A linear equation gives you a starting point, a direction, and a rate of change. Once you can read those clues, the graph is just the picture that follows.
Note: This article synthesizes standard linear-equation graphing methods commonly taught in U.S. algebra resources, including textbook-style lessons, open educational materials, and widely used math learning platforms. The content is fully rewritten for original web publication.