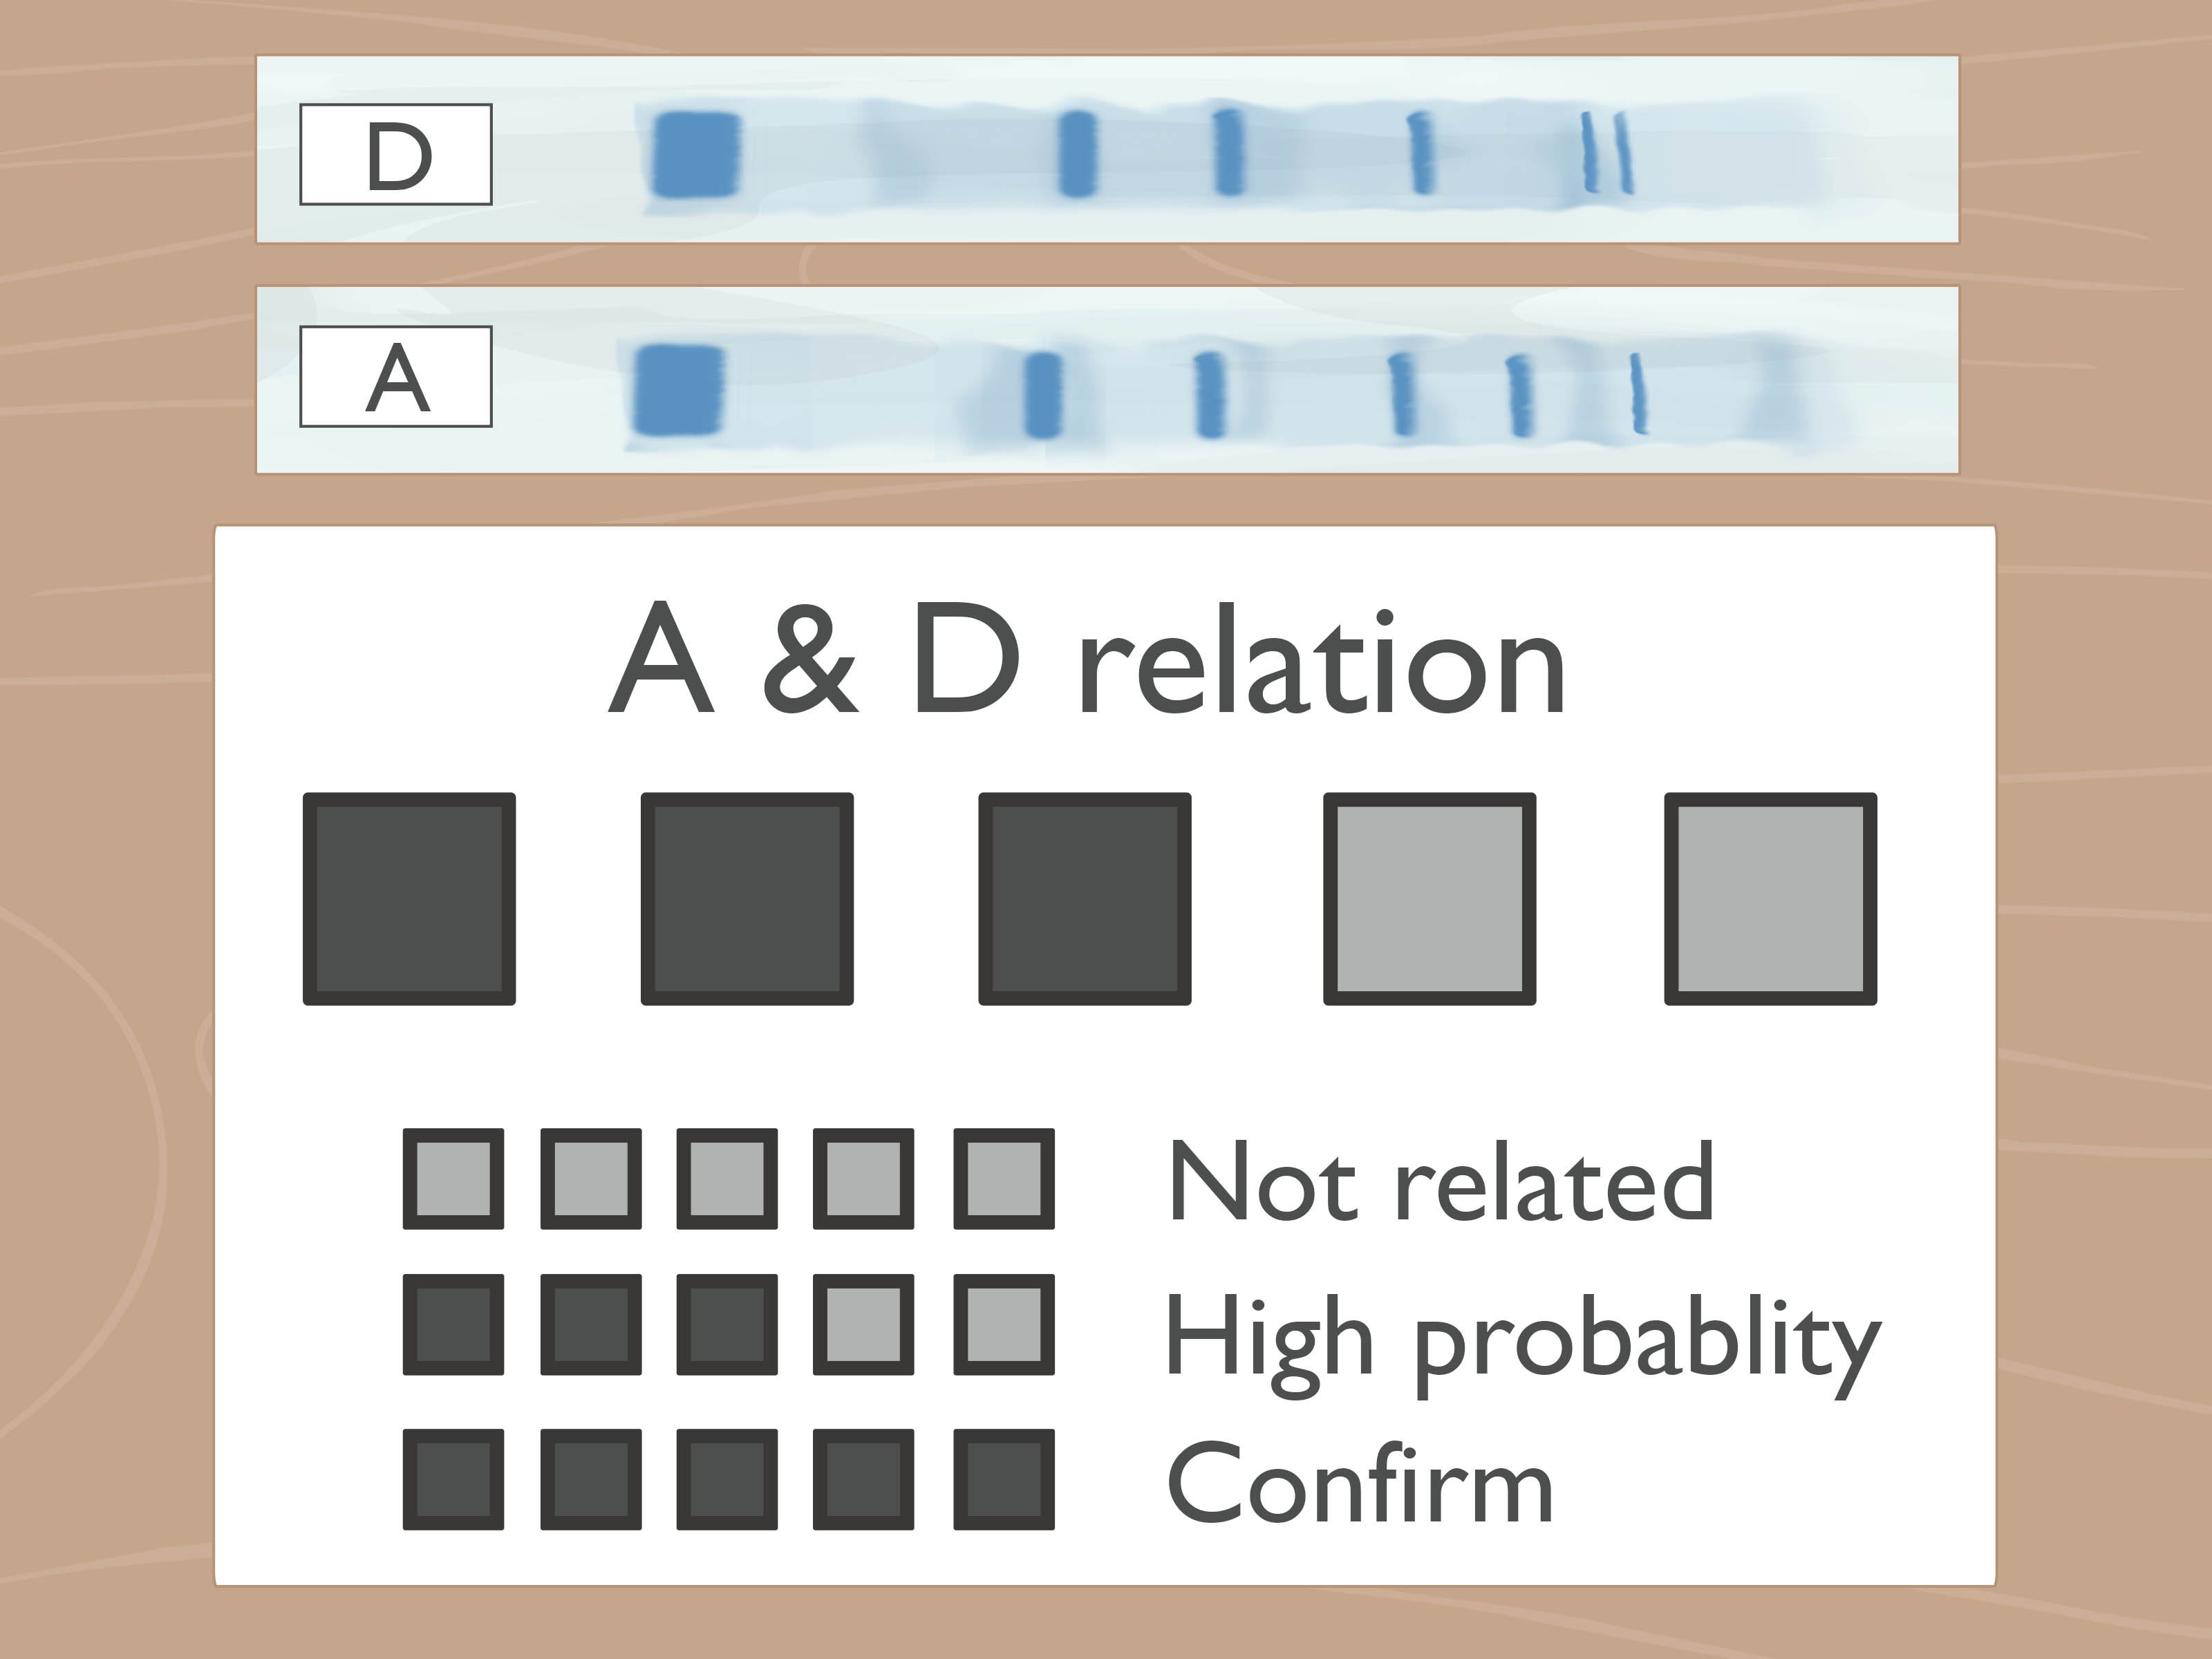
Gel electrophoresis bands can look mysterious at first, like tiny glowing barcodes left behind by very organized molecules. But once you understand what the lanes, ladder, band positions, and band brightness mean, a gel becomes much less like lab-room astrology and much more like a readable map. Whether you are checking PCR results, confirming a restriction digest, comparing DNA fragments, or wondering why your “beautiful clean band” has become a fluorescent spaghetti smear, this guide will help you interpret what you see.
In simple terms, gel electrophoresis separates DNA, RNA, or proteins by size and charge. In most beginner and molecular biology labs, the classic example is agarose gel electrophoresis for DNA. DNA has a negative charge, so when an electric current is applied, it travels through the gel toward the positive electrode. Smaller fragments move more easily through the gel matrix and travel farther; larger fragments lag behind closer to the wells. That is the basic rule of gel reading: lower bands are usually smaller, higher bands are usually larger.
What Are Gel Electrophoresis Bands?
A band is a visible line formed by many molecules of similar size collecting at roughly the same position in the gel. You are not seeing one DNA molecule. You are seeing a crowd. Think of it like a stadium section where everyone happens to be the same height and wearing neon jackets. The more DNA or protein in that size group, the brighter or thicker the band may appear, depending on staining, imaging conditions, and loading amount.
For DNA gels, bands are commonly visualized with stains that bind nucleic acids and glow under blue light or ultraviolet light. The gel itself acts like a molecular sieve. Small DNA fragments slip through the agarose pores quickly, while larger fragments lumber along more slowly. That is why a 100 base pair fragment appears farther from the well than a 3,000 base pair fragment, assuming both were run under the same conditions.
Start with the DNA Ladder
The DNA ladder is your ruler. Never interpret sample bands in isolation unless you enjoy scientific guessing games, which are fun at parties but dangerous in reports. A ladder contains DNA fragments of known sizes, such as 100 bp, 500 bp, 1 kb, 3 kb, and so on. By comparing your sample band to the ladder bands, you estimate the size of your fragment.
How to Use the Ladder Correctly
First, check whether the ladder ran properly. The bands should be reasonably clear and separated in the size range that matters to your experiment. If the ladder is smeared, faint, missing, curved, or compressed into a sad glowing blob, your sample interpretation becomes less reliable. A bad ruler makes a bad measurement, even if your sample lane looks photogenic.
Second, choose a ladder that covers your expected fragment size. If your PCR product should be around 1,200 bp, a 100 bp ladder may work well. If you expect a 10 kb plasmid fragment, you need a ladder with an upper range that includes that size. For very small fragments, a denser ladder with bands close together may improve size estimation. For very large fragments, a low-percentage agarose gel or specialized method may be needed.
Read the Gel from Top to Bottom
The top of the gel is near the wells, where the samples were loaded. Large fragments remain closer to this region because they move slowly through the gel. Smaller fragments migrate farther, so they appear lower. If your band is just below a 1,000 bp ladder band and above a 700 bp ladder band, your fragment may be roughly 800 to 900 bp. For a more accurate estimate, compare migration distance rather than simply eyeballing the nearest ladder label.
Band migration is not perfectly linear across all sizes. Smaller fragments may separate well in one region while larger fragments appear closer together in another. That is why ladder choice, gel percentage, voltage, buffer, and run time all affect readability. Molecular biology has rules, but it also has moods.
Understand Band Intensity
Band brightness often reflects quantity, but it is not a perfect measuring spoon. A brighter band usually means more DNA or protein is present at that position. A faint band suggests less material, weaker amplification, incomplete staining, underloading, degradation, or imaging settings that were too conservative.
However, brightness can fool you. Overloaded lanes can look thick, fuzzy, or smeared. Some ladder bands are intentionally brighter because manufacturers load more DNA at those reference sizes to help orientation. Exposure settings can also make faint bands look strong or strong bands look saturated. If you need true quantification, use appropriate software, standards, and controlled imaging conditions instead of the ancient method known as “squinting confidently.”
Common Band Patterns and What They Mean
One Clear Band at the Expected Size
This is the dream. If your sample shows one sharp band at the expected size, your reaction likely produced the target fragment. For example, if you ran a PCR expected to produce a 650 bp amplicon and your sample band aligns between the 600 bp and 700 bp ladder markers, that is a strong positive result. Celebrate modestly; the gel gods dislike arrogance.
No Band
No band means the target was not detected, or it was present below the detection limit. In PCR, this may result from missing template, degraded template, incorrect primers, failed polymerase, wrong annealing temperature, poor cycling conditions, inhibitors, or a loading mistake. Before blaming the universe, check the positive control. If the positive control also failed, the issue is probably procedural or reagent-related. If only your sample failed, the problem may be sample-specific.
Multiple Bands
Multiple bands may indicate nonspecific amplification, partial digestion, mixed templates, contamination, or expected fragment patterns. In PCR, extra bands often suggest primers binding to unintended sites. In restriction digestion, multiple bands may be exactly what you want if the enzyme cuts the DNA into predictable fragments. Always interpret the pattern in the context of the experiment.
Example: A plasmid cut with one restriction enzyme may produce one linear band equal to the plasmid size. A plasmid cut with two enzymes may produce two bands, such as a 4 kb backbone and a 900 bp insert. If you see those two bands, the digest likely worked. If you see an additional uncut plasmid band, the digest may be incomplete.
Smearing
A smear looks like a streak rather than a clean band. It may mean degraded DNA, too much sample, nuclease contamination, poor-quality template, high salt, protein contamination, excessive voltage, overheating, or poor gel conditions. In PCR, smearing can also happen when too many cycles are used or amplification is nonspecific. Smears are the gel’s way of saying, “Something happened, and I refuse to be more specific without better controls.”
Primer Dimers
Primer dimers are small unwanted products caused by primers binding to each other. They usually appear as faint bands near the bottom of the gel, often below 100 bp. If your expected PCR product is much larger and you see a tiny low band, that little troublemaker may be primer dimer. Adjusting primer design, annealing temperature, magnesium concentration, or cycle number may reduce it.
Bright Material Stuck Near the Wells
Large genomic DNA, overloaded samples, protein contamination, or very large plasmid forms can remain near the wells. If your sample barely enters the gel, consider whether the gel percentage is too high, the run time too short, the voltage too low, or the sample too large or contaminated.
How to Interpret Plasmid DNA Bands
Plasmid lanes deserve special attention because plasmids can appear in different physical forms. Uncut plasmid DNA may show more than one band even though it is the same plasmid. The most common forms include supercoiled, open circular, nicked, linear, and sometimes dimeric plasmid forms.
Supercoiled plasmid is compact and often migrates faster than linear DNA of the same size, so it may appear lower than expected. Open circular plasmid is relaxed and bulky, so it often migrates more slowly and appears higher. Linearized plasmid generally runs according to its actual length and is easier to size against a ladder. This is why comparing uncut plasmid directly to a linear DNA ladder can be misleading.
If you digest a plasmid with a single enzyme that cuts once, you should usually see one linear band at the full plasmid size. If you digest with two enzymes flanking an insert, you may see two bands: one for the vector backbone and one for the insert. If the insert band is very small, it may be faint or may run close to the dye front. Small fragments can be dramatic like that.
Controls Make Interpretation Easier
Controls are not optional decorations. They are the difference between interpretation and storytelling. A positive control confirms that the gel, stain, buffer, equipment, and reaction conditions can produce a detectable band. A negative control checks for contamination or nonspecific amplification. A no-template control in PCR should show no target band; if it does, contamination may be present.
For restriction digests, an undigested control helps distinguish uncut plasmid forms from true digestion products. A fully digested control or previously validated sample can show what the correct pattern should look like. When your gel includes the right controls, the bands become a conversation. Without controls, they become gossip.
Gel Percentage Matters
Agarose concentration determines how well different fragment sizes separate. Lower-percentage gels are better for larger DNA fragments because the pores are larger. Higher-percentage gels are better for smaller fragments because the pores are tighter and provide better resolution. A 1% agarose gel is a common general-purpose choice, but it is not magic. For small PCR products, a higher percentage may improve separation. For large fragments, a lower percentage may prevent everything from crowding near the top.
If two bands are close in size, your gel may need a longer run, a different agarose concentration, or a more appropriate ladder. A 300 bp and 350 bp fragment may not separate well on a casual gel run, while a 300 bp and 1,500 bp fragment should be much easier to distinguish.
Voltage, Buffer, and Run Time
Running a gel too fast can cause heat buildup, distorted bands, smiling lanes, and poor resolution. Running it too slowly can allow diffusion, making bands less sharp. The buffer also matters. Common DNA electrophoresis buffers include TAE and TBE, and the gel buffer should match the running buffer. Old, exhausted, diluted, or mismatched buffer can produce odd migration patterns.
Run time affects separation. If you stop too early, bands may be crowded together. If you run too long, small fragments may run off the gel entirely, making your tiny amplicon vanish like it had weekend plans. A common approach is to run until the tracking dye has moved an appropriate distance down the gel, but the exact timing depends on gel size, voltage, gel concentration, and target fragment size.
Step-by-Step Band Interpretation Checklist
1. Confirm the Gel Orientation
DNA runs from negative to positive. If your samples ran the wrong direction, they may have escaped into the buffer instead of entering the gel. In lab slang: always run to red.
2. Inspect the Ladder
Check that the ladder bands are visible, separated, and appropriate for your expected fragment range. If the ladder failed, interpret the gel cautiously.
3. Compare Sample Bands to the Ladder
Estimate size by comparing how far the sample band migrated relative to known ladder bands. For better accuracy, measure migration distance and use a standard curve.
4. Check the Expected Pattern
Ask what you expected before looking at the gel. One PCR product? Two restriction fragments? A genomic DNA smear? The correct interpretation depends on the experimental design.
5. Evaluate Band Sharpness and Brightness
Sharp bands suggest clean separation. Faint bands suggest low amount or weak detection. Smears suggest degradation, overloading, contamination, or poor running conditions.
6. Read the Controls
Positive controls should work. Negative controls should stay clean. If controls misbehave, sample conclusions become shaky.
7. Decide the Next Step
If the band is correct and clean, proceed to purification, sequencing, cloning, or reporting. If not, troubleshoot the sample, reaction setup, gel conditions, or imaging process.
Specific Examples of Gel Interpretation
Example 1: PCR Product Confirmation
You expect a 500 bp PCR product. The ladder shows bands at 400, 500, and 600 bp. Your sample lane has one bright band aligned with the 500 bp ladder band and no visible extra bands. Interpretation: the PCR likely amplified the correct product.
Example 2: Nonspecific PCR
You expect a 750 bp band, but the lane shows bands at 750 bp, 400 bp, and 1,200 bp. Interpretation: your target may be present, but nonspecific amplification also occurred. You may need to optimize annealing temperature, primer design, magnesium concentration, template amount, or cycle number.
Example 3: Incomplete Restriction Digest
You digest a plasmid expecting two fragments: 3,000 bp and 800 bp. The gel shows those two bands plus a band corresponding to uncut plasmid. Interpretation: digestion was incomplete. Possible causes include too little enzyme, short incubation time, incorrect buffer, methylation sensitivity, enzyme inactivity, or contaminants in the DNA prep.
Example 4: Degraded DNA
You load genomic DNA and see a broad smear extending down the lane rather than a strong high-molecular-weight band near the top. Interpretation: the DNA may be fragmented or degraded. Rough extraction, nuclease contamination, repeated freeze-thaw cycles, or old samples may be responsible.
Troubleshooting Strange Gel Results
Faint Bands
Faint bands may come from low sample concentration, insufficient staining, poor amplification, degraded DNA, or imaging exposure that is too low. Try loading more sample, improving template quality, checking stain concentration, or verifying that the imaging system is working properly.
Thick or Blurry Bands
Thick bands often mean too much sample was loaded. Overloading can reduce resolution and make bands appear wider than they should. Use less DNA or dilute the sample. Science is often about restraint, even when your pipette hand wants drama.
Curved or Smiling Bands
A smiling gel, where bands curve upward at the edges, often suggests uneven heating or excessive voltage. Running the gel at a lower voltage, using fresh buffer, and avoiding overloaded lanes can improve band shape.
Bands Running Unevenly Between Lanes
Uneven migration may result from salt contamination, unequal loading, damaged wells, bubbles, poor gel casting, or inconsistent sample preparation. If one lane looks strange while the ladder and other lanes look fine, the sample itself may be the issue.
Experience-Based Tips for Reading Gel Electrophoresis Bands
After you have looked at enough gels, you start to develop what many lab people jokingly call “gel eyes.” This is not a superpower, although it may feel like one at 11:47 p.m. when the transilluminator finally reveals whether your cloning experiment survived the day. Gel eyes simply mean you learn to read patterns quickly while still respecting controls, ladders, and experimental context.
One practical habit is to write down your expected band sizes before you run the gel. Do not wait until after imaging to decide what you “probably meant” to see. For example, if you expect a 1,100 bp PCR product, mark that in your notebook along with the ladder type, gel percentage, voltage, buffer, and sample order. When the gel appears, compare it to your plan. This prevents wishful interpretation, which is surprisingly persuasive when a deadline is breathing on your neck.
Another useful habit is to photograph or save every gel with clear labels. Label the ladder, sample lanes, controls, enzyme names, expected sizes, and date. Future you will be grateful. Future you is tired, holding coffee, and trying to remember whether Lane 6 was the negative control or the sample named “definitely_final_version_2.” Do future you a kindness.
When bands are faint, resist the temptation to immediately increase everything. More template, more cycles, more sample, and more voltage do not always equal better results. Sometimes they equal a glowing smear with emotional baggage. Instead, troubleshoot logically. If the ladder is bright but your sample is faint, the issue may be amplification or sample concentration. If both ladder and sample are faint, look at staining, imaging, or loading. If the negative control has a band, stop celebrating and check for contamination.
For students, one of the biggest breakthroughs is understanding that a gel does not answer every question by itself. It answers a specific question: what detectable molecules migrated to which positions under these conditions? A band at the expected size supports your hypothesis, but it does not always prove sequence identity. A PCR band at 500 bp may be the target, but sequencing or additional validation may be needed if precision matters. Similarly, a restriction digest pattern can support a plasmid map, but unexpected bands may require repeat digestion, enzyme checks, or diagnostic PCR.
A good interpretation also considers sample history. Old DNA, rough extraction, salt carryover, protein contamination, repeated freeze-thawing, and poor storage can all affect band quality. If one sample repeatedly smears while others look clean, the gel may not be the villain. The sample may have arrived at the gel already damaged, like a suitcase after a very aggressive airport conveyor belt.
Finally, learn to distinguish “good enough for the purpose” from “perfect.” A teaching gel, a cloning screen, a diagnostic digest, and a publication-quality figure do not all require the same standard. If your goal is to confirm that a 700 bp insert exists before miniprep screening, a clean band at the right size may be enough. If your goal is precise fragment sizing, quantification, or downstream sequencing, you need cleaner separation, appropriate controls, and careful documentation. Gel interpretation is not about staring harder; it is about asking the right question, using the right comparison, and knowing when the bands have told you enough.
Conclusion
Reading gel electrophoresis bands is a skill built from simple principles: smaller fragments travel farther, larger fragments stay closer to the wells, ladders provide size references, and controls keep your interpretation honest. A single sharp band at the expected size is usually good news. Missing bands, smears, extra bands, faint bands, and strange migration patterns are not failures; they are clues. The more carefully you connect band position, band intensity, sample type, ladder quality, and experimental design, the more confidently you can interpret your gel.
In the end, a gel is not just a glowing rectangle. It is a molecular report card. Sometimes it gives you an A. Sometimes it writes “see me after class” in fluorescent smear form. Either way, if you know how to read the bands, you know what to do next.