Note: This guide explains the intercepts method in clear classroom language, with examples, checks, and practical study experiences for studection: Why the Intercepts Method Is So Useful
Graphing linear equations can feel intimidating at first, especially when a problem tosses letters, numbers, plus signs, minus signs, and fractions onto the page like confetti at an algebra parade. The good news? A linear equation always graphs as a straight line, and a straight line only needs two points to get started. That is exactly why the intercepts method is one of the cleanest ways to graph a line.
The intercepts method uses two special points: the x-intercept and the y-intercept. The x-intercept is where the line crosses the x-axis. At that point, the y-value is always zero. The y-intercept is where the line crosses the y-axis. At that point, the x-value is always zero. Once you find those two points, you plot them, connect them with a straightedge, and congratulationsyou have graphed the equation without needing a calculator, a dramatic soundtrack, or emotional support from a geometry compass.
This method is especially helpful when the equation is written in standard form, such as Ax + By = C. For example, 2x + 3y = 12 is perfect for the intercepts method because you can quickly set one variable to zero, solve for the other, and get the two points you need. In this guide, you will learn how to graph linear equations using the intercepts method in seven simple steps, with examples, common mistakes, and practical tips that make the process easier to remember.
What Are Intercepts in a Linear Equation?
Before jumping into the steps, let’s make sure the vocabulary is clear. An intercept is a point where a graph crosses an axis. The coordinate plane has two main axes: the horizontal x-axis and the vertical y-axis. A line can cross one or both of these axes depending on its equation.
The x-intercept
The x-intercept is the point where the graph crosses the x-axis. Since every point on the x-axis has a y-coordinate of zero, the x-intercept always has the form (x, 0). To find it, substitute y = 0 into the equation and solve for x.
The y-intercept
The y-intercept is the point where the graph crosses the y-axis. Since every point on the y-axis has an x-coordinate of zero, the y-intercept always has the form (0, y). To find it, substitute x = 0 into the equation and solve for y.
The idea is simple: when you stand on one axis, the other coordinate disappears into zero. Algebra finally gives you permission to make something vanishresponsibly, of course.
How to Graph Linear Equations Using the Intercepts Method: 7 Steps
Step 1: Write the Equation Clearly
Start by copying the equation neatly. This sounds basic, but many graphing errors begin with a tiny copying mistake. A misplaced minus sign can send your line in the wrong direction faster than a GPS with a grudge.
The intercepts method works especially well with equations in standard form:
Ax + By = C
For example:
2x + 3y = 12
This equation has both an x term and a y term, so it should cross both axes unless something unusual happens. Keep the equation visible as you work, and leave enough space for your calculations.
Step 2: Find the x-Intercept by Setting y = 0
To find the x-intercept, remember this rule: on the x-axis, y = 0. Substitute zero for y in the equation and solve for x.
Using the example:
2x + 3y = 12
Set y = 0:
2x + 3(0) = 12
2x = 12
x = 6
So the x-intercept is:
(6, 0)
This point tells you the line crosses the x-axis at 6. In other words, move six units to the right from the origin and stay on the x-axis.
Step 3: Find the y-Intercept by Setting x = 0
Now find the y-intercept. On the y-axis, x = 0. Substitute zero for x in the equation and solve for y.
Use the same equation:
2x + 3y = 12
Set x = 0:
2(0) + 3y = 12
3y = 12
y = 4
So the y-intercept is:
(0, 4)
This means the line crosses the y-axis at 4. Starting at the origin, move four units up and place a point on the vertical axis.
Step 4: Organize the Intercepts in a Small Table
A table keeps your work tidy and helps prevent point-swapping mistakes. You do not need a giant table with seventeen rows and a personality crisis. Two rows are enough for the intercepts method.
| Intercept | Substitution | Point |
|---|---|---|
| x-intercept | y = 0 |
(6, 0) |
| y-intercept | x = 0 |
(0, 4) |
This table gives you the two points you need to graph the linear equation. It also gives you a quick way to check whether your coordinates make sense. The x-intercept should always have zero as the second number. The y-intercept should always have zero as the first number.
Step 5: Set Up the Coordinate Plane
Draw or use a coordinate plane with both axes labeled. The horizontal axis is the x-axis, and the vertical axis is the y-axis. Mark the origin (0, 0), then number the axes evenly. A messy scale can make a correct answer look wrong, which is deeply unfair but very common.
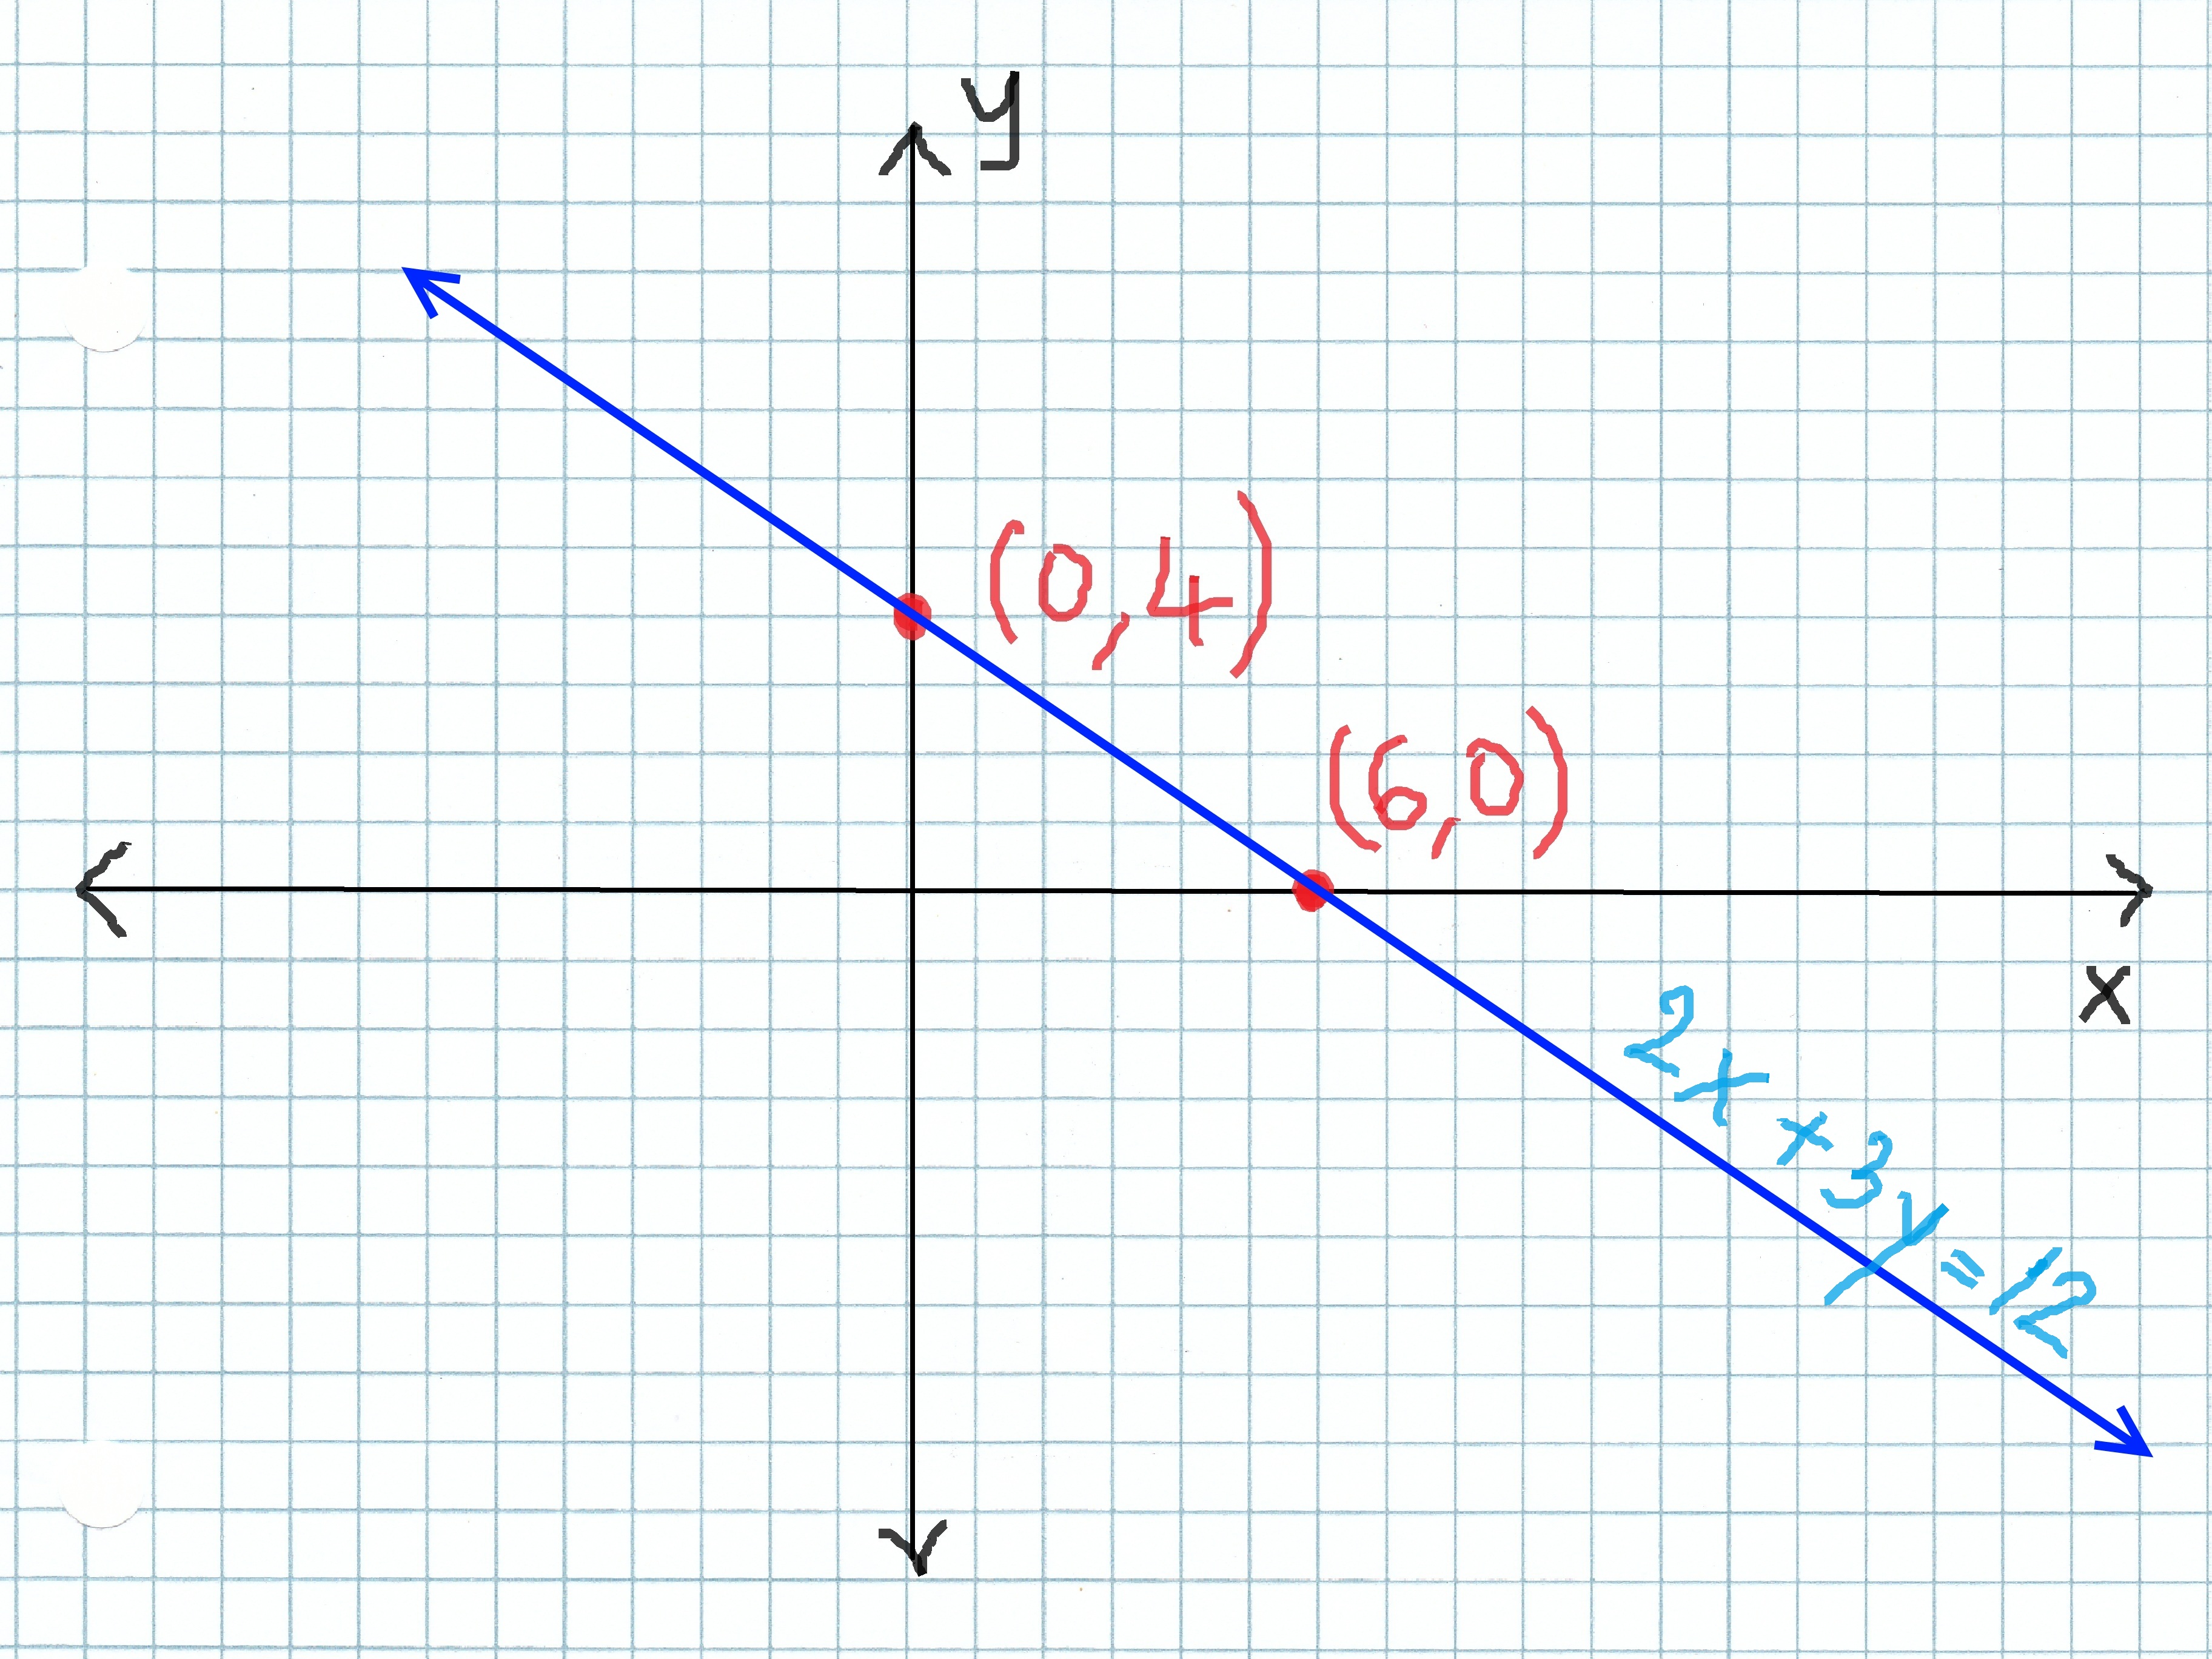
For the equation 2x + 3y = 12, your intercepts are (6, 0) and (0, 4). Make sure your graph includes at least x-values up to 6 and y-values up to 4. If you are working on graph paper, use each square as one unit unless your teacher or worksheet says otherwise.
When numbers are large, choose a scale that fits. For example, if your intercepts are (20, 0) and (0, 50), counting by ones may turn your graph into a wall mural. Instead, you might count by fives or tens.
Step 6: Plot the Two Intercepts and Draw the Line
Plot the x-intercept (6, 0) on the x-axis. Then plot the y-intercept (0, 4) on the y-axis. Once both points are placed, use a ruler or straightedge to draw a straight line through them. Extend the line beyond both points and add arrowheads at the ends to show that the line continues forever.
Why extend the line? Because a linear equation usually has infinitely many solutions. The two intercepts help you draw the line, but every point on that line is a solution to the equation. The intercepts are like the two reliable friends who show up early and help everyone else find the party.
Label the line with the equation, especially if you are graphing more than one line. A label such as 2x + 3y = 12 helps keep your work clear and prevents confusion later.
Step 7: Check Your Graph
Checking is the step students love to skip, and it is also the step that saves grades from suspicious-looking graphs. To check your work, choose a point on the line and substitute its coordinates into the original equation. The intercepts themselves are easy check points.
Check (6, 0):
2(6) + 3(0) = 12
12 = 12
Check (0, 4):
2(0) + 3(4) = 12
12 = 12
Both points work, so the graph is correct. If one point does not work, go back and check your substitution, arithmetic, and plotting. Most mistakes happen because a zero was put in the wrong place or a negative sign went on vacation without telling anyone.
Complete Example: Graph -2x + 4y = 8 Using Intercepts
Let’s walk through another example so the method feels automatic.
Find the x-intercept
Set y = 0:
-2x + 4(0) = 8
-2x = 8
x = -4
The x-intercept is (-4, 0).
Find the y-intercept
Set x = 0:
-2(0) + 4y = 8
4y = 8
y = 2
The y-intercept is (0, 2).
Graph the line
Plot (-4, 0) on the x-axis and (0, 2) on the y-axis. Draw a straight line through the points and extend it in both directions. That line is the graph of -2x + 4y = 8.
Notice that the x-intercept is negative, so you move left from the origin. Negative intercepts are not errors; they are just points that live on the other side of zero. They pay rent there and everything.
When Should You Use the Intercepts Method?
The intercepts method is most efficient when the equation is in standard form, such as 3x + 2y = 18, 5x - y = 10, or -4x + 8y = 16. In these equations, setting one variable to zero usually makes the arithmetic quick.
You can also use the intercepts method with slope-intercept form, such as y = 2x - 6. The y-intercept is already visible: (0, -6). To find the x-intercept, set y = 0:
0 = 2x - 6
6 = 2x
x = 3
So the x-intercept is (3, 0), and the y-intercept is (0, -6). Plot both points, connect them, and the graph is complete.
However, if the equation is already in slope-intercept form and the slope is simple, you may prefer the slope method. For example, with y = 3x + 1, it may be faster to start at (0, 1) and use the slope 3. The best method depends on the equation and what your teacher expects.
Special Cases: Horizontal and Vertical Lines
Most linear equations have both an x-intercept and a y-intercept, but some lines behave differently. Do not panic. They are not broken; they are just special.
Horizontal lines
A horizontal line has an equation like y = 4. Every point on the line has a y-coordinate of 4. This line crosses the y-axis at (0, 4), but it does not cross the x-axis unless y = 0. So y = 4 has a y-intercept but no x-intercept.
Vertical lines
A vertical line has an equation like x = -3. Every point on the line has an x-coordinate of -3. This line crosses the x-axis at (-3, 0), but it does not cross the y-axis unless x = 0. So x = -3 has an x-intercept but no y-intercept.
If the equation is x = 0, the graph is the y-axis itself. If the equation is y = 0, the graph is the x-axis itself. These are the minimalist celebrities of linear equations: simple, direct, and somehow still important.
Common Mistakes When Graphing with Intercepts
Mixing up the intercept rules
The most common mistake is reversing the substitutions. Remember: for the x-intercept, set y = 0. For the y-intercept, set x = 0. If that feels backward, think of it this way: the axis you are standing on keeps its variable, and the other variable becomes zero.
Forgetting negative signs
Negative signs are tiny but powerful. In an equation like -3x + 6y = 12, ignoring the minus sign changes the x-intercept completely. Slow down when dividing by a negative number.
Plotting coordinates in the wrong order
Coordinates are always written as (x, y). The first number moves left or right. The second number moves up or down. A point like (5, 0) is not the same as (0, 5). They may look like twins in a hurry, but they live on different axes.
Drawing a crooked line
A linear equation should graph as a straight line. Use a ruler when possible. If your line looks like it is trying to become a noodle, redraw it.
Practice Problems
Try graphing each linear equation using the intercepts method. Find the x-intercept, find the y-intercept, plot both points, and draw the line.
x + y = 53x + 2y = 124x - y = 8-2x + 5y = 106x + 3y = 18
Quick answers
x + y = 5: x-intercept(5, 0), y-intercept(0, 5)3x + 2y = 12: x-intercept(4, 0), y-intercept(0, 6)4x - y = 8: x-intercept(2, 0), y-intercept(0, -8)-2x + 5y = 10: x-intercept(-5, 0), y-intercept(0, 2)6x + 3y = 18: x-intercept(3, 0), y-intercept(0, 6)
Real Study Experiences: What Students Learn When They Use the Intercepts Method
One of the best experiences students have with the intercepts method is the moment they realize graphing does not have to begin with a long table of random values. Many students first learn to graph by choosing several x-values, substituting each one, solving for y, and then plotting a collection of points. That method works, but it can feel slow. The intercepts method feels like finding a shortcut through a maze after you have already walked the long way three times and questioned your life choices.
In classroom practice, students often say the intercepts method helps them understand what a line is actually doing. Instead of seeing an equation as a pile of symbols, they begin to connect algebra with movement on the coordinate plane. When y = 0, the graph touches the x-axis. When x = 0, the graph touches the y-axis. These two facts make the graph feel less mysterious. The equation is not hiding; it is giving directions.
Another common experience is learning to respect the coordinate order. At first, students may accidentally plot (0, 6) where (6, 0) should go. This mistake is normal, and honestly, it is almost a rite of passage. After a few examples, the pattern becomes clearer: x moves sideways, y moves vertically. Once that idea clicks, plotting points becomes much smoother.
The intercepts method also builds confidence because it gives students a predictable routine. Step one, set y = 0. Step two, solve for x. Step three, set x = 0. Step four, solve for y. Step five, plot and connect. Routines matter in math because they reduce the amount of guessing. When students know what to do first, second, and third, the problem feels less like a locked door and more like a checklist.
Students also learn that arithmetic accuracy matters. A small division error can move an intercept to the wrong location, which changes the entire graph. This is frustrating at first, but it teaches a useful habit: check the intercepts by substituting them back into the original equation. If the point works, it belongs on the line. If it does not, something needs fixing. This habit becomes valuable later in algebra, especially when solving systems of equations, graphing inequalities, and interpreting linear models.
Another practical experience is discovering that not every line behaves the same way. Horizontal and vertical lines can surprise students because one intercept may be missing. For example, y = 5 never touches the x-axis, and x = -2 never touches the y-axis. These special cases help students understand graphs more deeply instead of memorizing steps without thinking.
Finally, the intercepts method makes math feel more visual. Students who struggle with abstract equations often appreciate seeing the answer appear on a graph. The line becomes proof that the equation has structure. It crosses the axes at meaningful points, continues in both directions, and represents every solution that satisfies the equation. That is the quiet beauty of linear equations: once you understand the intercepts, the graph stops looking like a mystery and starts looking like a map.
Conclusion
Learning how to graph linear equations using the intercepts method is one of the most useful skills in early algebra. The process is simple: find the x-intercept by setting y = 0, find the y-intercept by setting x = 0, plot both points, and draw a straight line through them. With just two points, you can graph an entire linear equation.
The method works especially well for equations in standard form, but it can also help with other forms of linear equations. The key is understanding what intercepts mean. The x-intercept is where the line crosses the x-axis, and the y-intercept is where it crosses the y-axis. Once those points make sense, the graph becomes much easier to build.
To improve, practice with different equations, check your answers by substitution, and watch out for negative signs. A few careful habits can prevent most graphing mistakes. And remember: algebra is not about being instantly perfect. It is about learning patterns, testing ideas, and slowly becoming the kind of person who can look at 3x + 2y = 12 and calmly say, “Yes, I know exactly what to do.” That is growth. That is math confidence. That is also a pretty good reason to keep a ruler nearby.