Polls appear to ask a simple question: “What do people think?” Unfortunately, people are complicated, memories are fuzzy, civic virtue is fashionable, and some respondents treat a survey like a tiny job interview. They do not always report what they did or what they believe. Sometimes they polish the truth. Sometimes they guess. Sometimes they change their minds after hanging up. And sometimes the people who would have answered differently never picked up the phone in the first place.
That does not make public opinion polling useless. It makes polling a measurement problem rather than a crystal-ball business. Understanding the difference is the key to reading election polls without either worshipping them or throwing them into the nearest recycling bin.
The Original Problem: People Want to Look Good
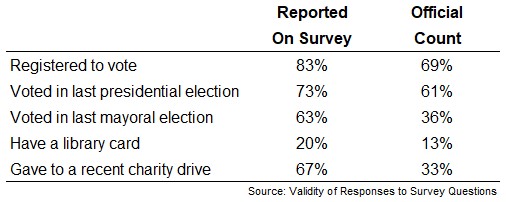
Long before online panels, predictive models, and television maps with enough flashing colors to guide aircraft, survey researchers knew that respondents could be unreliable narrators. A landmark 1950 study in Denver compared residents’ answers with official records involving voting, voter registration, charitable giving, and library cards. Even questions that appeared factual produced inaccurate answers.
The lesson was not that Denver had an unusually devious population. The lesson was that ordinary people often answer as the person they would like to be. The imagined citizen votes in every election, donates generously, reads serious books, exercises regularly, and never eats shredded cheese directly from the refrigerator at midnight. The real citizen has laundry on the chair and may not remember which municipal election occurred three Tuesdays ago.
Social Desirability Bias
Survey researchers call this tendency social desirability bias. Respondents may overstate admired behavior, such as voting or charitable giving, while understating behavior that could seem embarrassing, selfish, prejudiced, unhealthy, or irresponsible.
Political surveys are especially vulnerable because politics is tied to identity. A question about a candidate may feel less like a request for information and more like a demand to announce which team jersey is hiding under the respondent’s jacket. When an interviewer is present, even by telephone, the pressure to sound reasonable or respectable can become stronger.
Self-administered online surveys can reduce some of that pressure. People may be more candid when no human voice is waiting on the other end. Research comparing telephone and web surveys has found meaningful differences in how sharply respondents criticize politicians, discuss sensitive social issues, or evaluate their personal lives. In other words, the survey method can influence the answer even when the question remains unchanged.
Do Voters Lie to Pollsters About Their Candidate?
The “shy voter” theory is irresistible because it offers a neat explanation for a messy result: supporters of a controversial candidate secretly plan to vote one way while telling pollsters something else. It is also a theory that should be handled carefully.
Some individuals undoubtedly conceal or soften their political preferences. Yet a polling miss does not prove that millions of voters lied. The same error can emerge when one political group is less likely to participate, when a sample contains too many college graduates, when undecided voters break heavily in one direction, or when a likely-voter model guesses turnout incorrectly.
This distinction matters. Deliberate misreporting is a measurement error: the pollster reached the right person but received the wrong answer. Nonresponse bias is a representation error: the pollster did not hear from enough of the right people. Both can bend a result, but they require different repairs.
People Also Lie About Whether They Voted
Post-election surveys regularly find more self-described voters than official turnout records would suggest. In one Pew Research Center analysis following the 2014 midterm election, approximately one in six people who said they had “definitely voted” could not be matched to a voting record in commercial voter files.
Not every unmatched record proves dishonesty. Names change, addresses move, databases contain errors, and matching systems are imperfect. Still, decades of validation research show that vote overreporting is real. People feel pressure to behave like good citizens, and saying “Yes, I voted” is easier than explaining that Election Day collided with work, childcare, illness, transportation, or plain forgetfulness.
The Sample Can Lie Even When Respondents Tell the Truth
Imagine surveying 1,000 perfectly honest people. If those people are systematically different from the population, the result can still be wrong. Honesty does not rescue an unrepresentative sample.
Nonresponse Bias: The Missing Voices Problem
Response rates have fallen as people screen unknown calls, ignore unfamiliar texts, distrust institutions, and protect their inboxes as though they contain classified documents. Low response rates do not automatically destroy a poll. A small but representative sample can outperform a huge, distorted one. Trouble begins when willingness to participate is connected to the opinion being measured.
Suppose politically engaged college graduates answer surveys more often than less engaged non-college voters. A pollster can weight the sample by education, age, race, sex, and region. But when reluctant respondents differ in ways not fully captured by those categories, some bias remains. Weighting is powerful; it is not wizardry.
Why Bigger Is Not Always Better
A poll with 100,000 respondents may look invincible next to a poll with 1,000. Yet sample quality matters more than raw size. A massive opt-in survey can produce a beautifully precise estimate of the wrong population. Its reported margin of error may be tiny while its actual bias wears work boots.
This is why reputable pollsters disclose how respondents were recruited, which population was studied, how answers were weighted, when interviews occurred, and how questions were worded. A clear methodology section is often more valuable than a dramatic headline.
Why Election Polling Is Exceptionally Difficult
Most surveys ask what adults currently believe. Election polls must answer a harder question: who will actually show up, and what will those people do when they get there?
Likely-Voter Models Are Educated Guesses
Not every registered voter votes. Pollsters therefore build likely-voter models using past participation, interest in the election, stated intention, registration records, demographics, and other signals. Different organizations make different choices, which is one reason two respectable polls conducted at the same time can disagree.
A turnout model can fail even when candidate preference is measured accurately. If young voters participate more than expected, rural turnout surges, or occasional voters unexpectedly stay home, the final electorate will not resemble the modeled electorate. The recipe was fine; the dinner guests changed.
Late Deciders and Genuine Opinion Changes
Polls are snapshots taken during a moving event. A respondent who honestly prefers Candidate A on Friday may choose Candidate B on Tuesday. Campaign news, debates, endorsements, personal conversations, weather, and strategic considerations can shift choices after a poll’s field period ends.
This was part of the story in several battleground states in 2016, when late-deciding voters moved strongly toward Donald Trump. Another problem was that many state polls did not adequately weight respondents by education, even though educational attainment was strongly related to candidate preference. The error was not one enormous lie. It was several smaller problems arriving in the same trench coat.
Small Errors Can Look Huge on Election Night
A three-point miss may sound modest, but in a close state it can change the apparent winner. Because the Electoral College depends on state outcomes, correlated polling errors across several battlegrounds can transform a narrow national mistake into a dramatic map failure.
That is why “Who is leading?” is often less useful than “What range of outcomes remains plausible?” A candidate at 48% and another at 47% are not separated by a magical wall. They are standing inside overlapping clouds of uncertainty while television graphics politely pretend those clouds have sharp edges.
What 2016, 2020, and 2024 Taught Pollsters
The 2016 national polls were reasonably close to the popular-vote result, but many state polls underestimated Republican support. Education weighting and late movement were important contributors. In 2020, polls correctly indicated that Joe Biden was favored to win, yet they overstated his margin in many places and underestimated Republican candidates farther down the ballot.
Researchers considered several possible explanations for 2020, including unusual pandemic-era campaigning, turnout-model challenges, differential response, and the possibility that some Republican voters had become especially reluctant to participate in surveys. No single theory neatly explained every race, state, and polling method.
Public polling performed better in 2024. The overall portrait of a close national contest and competitive swing states was largely accurate, although Republican support was still somewhat underestimated on average. That improvement matters because it shows that polling errors are not permanently fixed in one direction or size. Methods adapt, electorates change, and every election creates a new exam with several questions printed upside down.
Polls Are Estimates, Not Predictions
A pre-election poll measures stated preference among a sample during a particular period. A forecast combines polls with additional assumptions and estimates the probability of an outcome. A poll showing a two-point lead does not mean a candidate will win by exactly two points. It means the collected data, after adjustment, produced an estimated lead at that moment.
Even the familiar margin of error tells only part of the story. It generally describes uncertainty associated with sampling, not every possible threat to accuracy. It does not fully capture nonresponse bias, faulty weighting targets, turnout-model mistakes, question effects, processing errors, or late shifts in opinion.
Readers should therefore resist false precision. A result of 49.2% versus 47.8% may look as exact as a restaurant bill, but public opinion is not a restaurant bill. It is closer to estimating the number of pigeons in a park while the pigeons are flying.
How Pollsters Reduce Misreporting and Bias
Good survey design does not assume respondents are villains. It assumes they are human. Researchers use several techniques to make accurate answers easier.
Use Neutral, Forgiving Questions
Instead of bluntly asking, “Did you vote?” a survey might acknowledge that many people intended to vote but were prevented by work, illness, or other circumstances. This wording reduces the feeling that “I did not vote” is a confession delivered under courtroom lighting.
Protect Respondent Privacy
Self-administered surveys can encourage greater candor on sensitive topics. Clear explanations of confidentiality may also help, although some respondents will remain concerned about how their information could be used.
Validate Behavior When Possible
Researchers can compare reported turnout with voter files, benchmark demographic answers against government statistics, and test survey estimates against reliable administrative data. Validation does not eliminate every error, but it can reveal where the mirror is warped.
Weight Transparently
Responsible pollsters explain which characteristics were used in weighting and how much adjustment occurred. Extremely large weights can make a handful of respondents carry the statistical equivalent of a grand piano.
Test Multiple Modes and Models
Phone, text, mail, and online approaches reach different people and may produce different answers. Mixed-mode research, probability panels, voter-file samples, and alternative turnout models give pollsters more opportunities to identify fragile assumptions.
How to Read a Political Poll Without Losing Your Mind
- Check the field dates. A poll conducted before a major event cannot measure reactions that occurred afterward.
- Study the population. Adults, registered voters, and likely voters are different groups.
- Look beyond one poll. Averages and trends are usually more informative than one surprising result.
- Read the exact wording. Small changes in phrasing or answer order can influence responses.
- Inspect the methodology. Recruitment, survey mode, weighting, sample size, sponsorship, and transparency all matter.
- Treat tiny movements cautiously. A one-point change may be noise wearing a press badge.
- Separate probability from certainty. A 70% chance still includes a 30% chance, which is not a rounding error.
Experience Notes: What Polling Uncertainty Feels Like
The following scenes are composite examples based on common situations in polling, analytics, newsrooms, campaigns, and everyday conversations. They are illustrative rather than claims of personal participation.
The Election-Night Refresh Spiral
A familiar polling experience begins with confidence and ends with someone refreshing a county-results page every twelve seconds. Before voting ends, an analyst has a tidy spreadsheet, a polling average, and several carefully modeled scenarios. Then the first returns arrive from a county that is either unusually rural, unusually urban, or unusually fast at counting. The model lurches. Social media declares a landslide. Ten minutes later, another batch of ballots arrives and the landslide changes direction.
The practical lesson is humbling: early data are not necessarily representative data. Election returns arrive in an order, and that order can create illusions. Mail ballots, early votes, and Election Day votes may favor different candidates. The same principle applies to polling. The first people who answer a survey are not automatically miniature versions of everyone else.
The Respondent Who Wants to Be Helpful
Another common experience emerges while testing a questionnaire. A respondent encounters a policy they have never heard of, pauses, and selects an answer anyway. They are not deliberately deceiving the researcher. They are trying to be cooperative. “I don’t know” feels unhelpful, so they manufacture a mild opinion from the wording, party cue, or emotional flavor of the question.
This is why good questionnaires avoid unnecessary jargon, provide legitimate ways to express uncertainty, and randomize response options when appropriate. Sometimes the most accurate answer is, “I have not thought about this enough.” Unfortunately, that sentence rarely gets invited onto cable news.
The Family Poll With a Sample Size of Seven
People also conduct accidental polls every day. Someone asks relatives at dinner which candidate they support, receives six similar answers, and concludes that the entire state is obvious. The sample has several minor defects: it is tiny, geographically clustered, socially connected, and influenced by whoever controls the mashed potatoes.
This experience explains why scientific sampling matters. Polling is not merely asking a large number of people. It is building a defensible bridge from the people who answered to the population being described.
The Surprising Cross-Tab
In professional analysis, the most dangerous moment can be discovering an exciting subgroup result. Perhaps one candidate suddenly gains 14 points among suburban fathers who own dogs and watched a debate. Before writing the headline, the analyst checks the subgroup size and finds 47 respondents. The apparent political earthquake may represent only three people changing answers.
Experienced readers learn to ask whether a cross-tab is stable, whether the theory was proposed before the data appeared, and whether other surveys show the same pattern. Interesting does not always mean real. Sometimes interesting means the spreadsheet found a kazoo.
The Best Habit Polling Teaches
The most valuable experience polling offers is not prediction. It is disciplined uncertainty. Polls force researchers to state assumptions, quantify doubt, compare estimates with outcomes, and admit when a model missed. That habit is useful far beyond elections. Businesses forecast demand, investors estimate risk, doctors interpret tests, and families plan budgets under uncertainty.
Everybody may lie occasionally, but data do not become useless merely because humans are messy. The answer is better questions, better samples, better validation, and less theatrical certainty. A poll should begin a conversation about what is plausible. It should not end the conversation by pretending the future has already signed the paperwork.
Conclusion
“Everybody lies” is a memorable warning, but it is not a complete theory of polling error. Respondents may misreport, forget, rationalize, or hide. Samples may exclude crucial voices. Weighting may correct the wrong variables. Turnout models may imagine an electorate that never arrives. Journalists may convert estimates into prophecies, and audiences may confuse a probability with a promise.
The healthiest approach is neither blind faith nor fashionable cynicism. Polls remain one of the best tools available for measuring public opinion when they are designed carefully and interpreted honestly. Read several polls, examine their methods, respect uncertainty, and remember that the number on the screen is an estimate of human behaviornot a notarized message from the future.